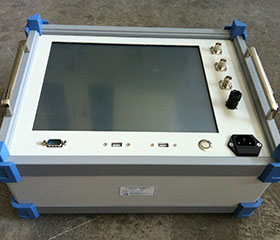
I. Instrument Overview
The HDRZ-3000 Transformer Winding Deformation Tester measures the characteristic parameters of the transformer's internal windings and uses the internal fault frequency response analysis (FRA) method to accurately diagnose internal transformer faults.
After a transformer is designed and manufactured, its coils and internal structure are fixed. Therefore, for a multi-winding transformer coil, if the voltage levels are the same and the winding method is the same, the corresponding parameters (Ci, Li) of each coil should be determined. Consequently, the frequency domain characteristic response of each coil is also determined, and the frequency spectra of the three-phase coils are comparable to a certain extent.
During testing, if inter-turn or phase-to-phase short circuits occur, or if the transformer experiences impacts during transportation causing relative displacement of coils, or if electromagnetic forces during short circuits and fault conditions cause coil deformation, the distributed parameters of the transformer windings will change. This in turn affects and alters the original frequency domain characteristics of the transformer, such as amplitude changes in the frequency response and shifts in resonant frequency points. The transformer winding tester developed based on the response analysis method is such a novel non-destructive testing device for internal transformer faults. It is suitable for detecting internal structural faults in 63kV to 500kV power transformers.
The HDRZ-3000 Transformer Winding Deformation Tester quantifies the response changes of the transformer's internal winding parameters in different frequency domains. Based on the magnitude of the change, the amplitude of the frequency response variation, the region, and the trend of the frequency response change, it determines the degree of deformation of the internal windings. This allows the measurement results to be used to judge whether the transformer has been severely damaged and whether major repairs are needed.
For transformers in operation, regardless of whether frequency domain characteristic graphs have been saved in the past, the degree of fault can also be assessed by comparing the differences in characteristic spectra between the coils of the faulty transformer. Of course, if a set of the transformer's original winding characteristic graphs is preserved, it is even easier to provide more precise and powerful evidence for the transformer's operating condition, post-accident analysis, and maintenance and repair.
The Transformer Winding Deformation Tester consists of a laptop computer and a microcontroller, forming a high-precision measurement system. It is compact in structure, simple to operate, and has relatively complete testing and analysis functions. It can be used independently after referring to the instruction manual or after short-term training.
II. Technical Features
1. The acquisition control uses a high-speed, highly integrated microprocessor.
2. Communication between the laptop and the instrument is via a USB interface.
3. The industrial computer and the measuring instrument are integrated, so no mobile computer is needed at the measurement site.
4. The hardware core uses a DDS dedicated digital high-speed frequency sweep technology (from the USA), which can accurately diagnose faults such as winding distortion, bulging, displacement, tilting, inter-turn short circuit deformation, and phase-to-phase contact short circuits.
5. High-speed dual-channel 16-bit A/D sampling (field tests show obvious changes in waveform curves when the tap changer is changed).
6. The signal output amplitude is software-adjustable, with a maximum peak amplitude of ±10V.
7. The computer generates an electronic document (Word) of the test results.
8. The instrument has dual measurement system functions: linear frequency sweep measurement and segmented frequency sweep measurement, compatible with the two current domestic technical measurement modes.
9. The amplitude-frequency characteristics comply with the national technical indicators for amplitude-frequency characteristic testers. The horizontal axis (frequency) has both linear and logarithmic scales, so the printed curves can be either linear or logarithmic, depending on the user's actual needs.
10. Automatic data analysis system for test data,
Horizontal comparison: compare winding similarity among phases A, B, and C,
The analysis results are:
①Very good consistency
②Good consistency
③Poor consistency
④Very poor consistency,
Vertical comparison: A-A, B-B, C-C, retrieve original data and compare with current data for the same phase to assess winding deformation,
The analysis results are:
&nbs