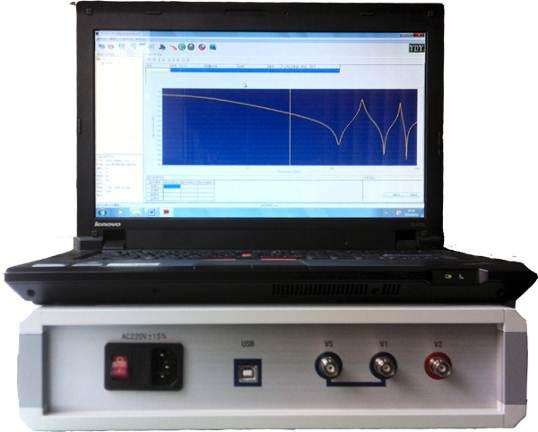
Transformer Winding Deformation Tester
Features:
1, Transformer Winding Deformation Tester consists of a measurement part and an analysis software part. The measurement part is controlled by a high-speed microcontroller, comprising signal generation and signal measurement. The analysis part is completed by a laptop. The measurement part connects to the laptop via a USB universal interface, plug-and-play, and is easy to use.
2. During the test, only the connecting busbars of the transformer need to be removed; all tests can be completed without lifting the transformer cover or disassembling it.
3. The instrument features dual measurement systems: linear sweep frequency measurement and segmented sweep frequency measurement, compatible with the two current domestic technical approaches. The linear sweep frequency measurement scans up to 2MHz, providing more analysis for transformer deformation.
4. The instrument is highly intelligent and easy to use, with functions such as automatic range adjustment and automatic sampling frequency adjustment.
5. The software runs on the Windows platform, compatible with Windows 98/2000/winXP.
6. Provides historical curve comparison analysis, allowing multiple historical curves to be loaded simultaneously for observation, and specific frequency bands can be selected for amplification for horizontal and vertical analysis. Equipped with an expert intelligent analysis and diagnosis system, it can automatically diagnose the state of transformer windings, load up to 6 curves simultaneously, automatically calculate related parameters of each curve, automatically diagnose winding deformation, and provide diagnostic reference conclusions.
7. The software has powerful management functions, fully considering the needs of field use. It automatically saves environmental condition parameters to provide a basis for transformer winding deformation diagnosis. Measurement data is automatically saved, and color printing is available for users to generate test reports conveniently.
8. The software is highly user-friendly; most measurement conditions are selectable options. Detailed transformer parameters can be saved for diagnostic reference, and they do not need to be entered on-site; modifications can be added later, making it more convenient to use.
9. The software is highly intelligent. After connecting the input and output signals and setting the condition parameters, all measurement work can be completed, and historical waveform curves can be opened for comparison and observation at any time during measurement, and measurement can be stopped.
10. The time required for each phase measurement is less than 60 seconds. For a power transformer with high, medium, and low windings (regardless of capacity and voltage level), the total time for winding deformation measurement does not exceed 10 minutes.
11. When measuring transformers, wiring personnel can arbitrarily place signal input and output leads without affecting the measurement results. Wiring personnel can stay on top of the transformer oil tank without having to come down, reducing labor intensity.
Detection Principle:
Under higher frequency voltage, each winding of the transformer can be regarded as a passive linear two-port network composed of distributed parameters such as linear resistance, inductance (mutual inductance), and capacitance. Its internal characteristics can be described by the transfer function H(jω). If the winding deforms, the distributed inductance, capacitance, and other parameters inside the winding will inevitably change, causing the zeros and poles of the equivalent network transfer function H(jω) to change, thereby altering the frequency response characteristics of the network.
The amplitude-frequency response characteristics of the transformer winding are obtained by frequency sweep. By continuously changing the frequency f of the external sinusoidal excitation source VS (angular frequency ω=2πf), the ratio of the signal amplitudes of the response terminal voltage V2 and the excitation terminal voltage V1 at different frequencies is measured, obtaining the amplitude-frequency response curve of the winding under specified excitation and response terminals. L, K, and C represent the distributed inductance, distributed capacitance, and distributed capacitance to ground per unit length of the winding, respectively. V1 and V2 are the excitation terminal voltage and response terminal voltage of the equivalent network, VS is the sinusoidal excitation signal source voltage, RS is the output impedance of the signal source, and R is the matching resistor.